People analytics can feel daunting to many in HR. It may be unfamiliar, challenging to understand, or even difficult to acquire internally or to leverage. It can be hard to know where to start and what to measure. And data will never smile at you and give you the “thank you” you receive when you deliver a customized benefit or new learning opportunities to employees. However, the future of HR is data-driven. By equipping yourself with the right people analytics capabilities, you can make the best decisions for your workforce and position yourself as a strategic advisor to the business while also removing complexity from your role.
People analytics doesn’t need to feel intimidating or cold. Although data will never give you a high-five or a “clapping hand” emoji, intelligent analytics can make a tremendous difference in improving culture, retention, engagement, performance, DEIB, and employee satisfaction — and put a smile on the faces of those in the C-suite and the workforce.
In this article, I explain why the people data you have may not be the data you need to succeed, the challenges many organizations face in gathering the right data, the outcomes you can achieve with people analytics, and the people analytics capabilities that should be present in your analytics tool.
People analytics is like a health app
Many of us use a health or fitness app to track our steps, exercise levels, calories burned, heart rate, our moods, and more. This data allows us to decide when we need to exercise more and what type of exercise we might want to engage in. Maybe we’re due up for a hearty hike or tough workout at the gym rather than a walk around the neighborhood.
Without this information, or with incomplete information, we might make the wrong choices. For example, if my health app tells me my exercise levels and mood have been low, but my heart rate is up, that could signal to me that I’m stressed and might be personally better off doing a gentler form of exercise like yoga or a walk in the woods rather than going on a heart-pounding run.
In the same way, the right people analytics capabilities can help you make decisions that yield the best workforce and business outcomes. People data that is too shallow or incomplete can lead organizational leaders to draw the wrong conclusions or fail to understand the sources of their workforce’s challenges or even their successes.
People are an organization’s most valuable asset, not the code or the products they develop. It’s the people who are creating those strategies, solutions, and products. Making workforce decisions based on gut reaction, sentiment, or incomplete data will likely adversely affect your worker population. Over time, looking at the wrong data, having insufficient data, or drawing the wrong conclusions from it causes you to fall out of step with your organization’s needs. The compounding effect may be seen in higher turnover, lower engagement, and a toxic work culture.
Conversely, if you understand your data correctly, you can spot trends and the underlying behaviors and actions influencing factors like retention, engagement, productivity, DEIB, and career advancement. You can discover leading indicators that can help you mitigate risks, and spot lagging indicators to help you correct trouble spots to improve overall workforce management. The right people analytics capabilities, and right employee apps will help you optimize your HR strategies.
When “good enough” people analytics isn’t
The best way to explain why the sentiment of “good enough” can lead an organization down the wrong path is by way of example. Let’s say your turnover rate is low. You obviously want to keep it that way. Knowing what contributes to the low rate is essential: Is it culture? Your promotion process? Your benefits and compensation? Internal growth opportunities? Strong managers who regularly interact with their reports? If you don’t have a comprehensive understanding of the key factors contributing to the low turnover, how will you know what actions to continue or which ones are not impactful and can be retired or altered?
Alternatively, you may have high attrition in certain areas of the company. Perhaps your existing data shows that these teams, nonetheless, have high completion rates on their performance reviews. Without more granular data and analysis, you won’t know the issues. Richer data might reveal that these teams generally have less frequent manager-employee conversations than high-performing groups. Or, the data could reveal a stressful environment where a manager is ineffective, but the team is pulling together despite poor leadership, although at a high cost to their wellness. By cross-correlating this detail with data about manager tenure, you may discover that the managers of these teams are newer managers with less tenure. This could indicate a need to bolster your manager support training and mentoring for new and less experienced managers.
You could cross-correlate this data with demographic data and find that black and Hispanic employees are leaving at higher rates because they are not receiving similar career development opportunities as their white counterparts. This revelation could lead you to change your DEIB programs to ensure fairness and equal opportunity.
Access to the right data and the ability to drill down and investigate underlying data can reveal powerful insights to help you make the right decisions about your workforce and help your employees prosper.
People analytics challenges
When HR experiences a disconnect with translating its people data into meaningful analysis, it’s usually due to one of four key factors: the data resides in too many different places in the organization, is thin, is shallow, or is not readily available. Let’s briefly take a look at each of these.
Disparate data
Many organizations have many systems with their HR tech stack — such as ATS, engagement surveys, tracking systems, and performance management — but find it difficult to access and extract the right data from the right system to draw the right conclusions.
Infrequently collected data
If HR wants to understand the behaviors of its workforce better to improve performance and the many facets related to it — including manager effectiveness, engagement, retention, career development, and productivity — it can be challenging to acquire adequate data to aid performance-related decision-making. This is akin to a “garbage in, garbage out” problem.
Often, enterprises will use HCMs as their system of record and for performance management. While these compliance-based systems are good for activities such as payroll, benefits, and business processes, they are often underutilized by employees for performance-related activities because they are not engaging or easy to use in the flow of work. Employees may log in to these systems’ performance management modules only a couple of times a month or a few times a year. There will not be enough data to help HR understand daily and weekly activities that impact performance, such as manager-employee conversations, team or colleague feedback, goal-setting and attainment, and recognition.
Shallow data
Related to infrequent data, shallow data refers to insufficient data to make intelligent decisions. Companies typically collect retention, turnover, engagement, internal mobility, productivity, and other high-level data or metrics. For performance management activities, they likely collect adoption data (e.g., how many people are completing their goals, performance reviews, and learning and development courses) but the data may not be granular enough for them to drill down to understand the underlying reasons for low or high performance of a team or individual.
With limited insights, HR can draw incorrect conclusions or be unable to act at all. It may not even realize there are problems.
Data accessibility
HR organizations with an HRIT function can request and access data from their dedicated source. Internal HRIT staff often build their own analytics dashboards, although it is time-consuming. In organizations without a dedicated HRIT team, analytics is a shared resource among multiple departments. HR may have to “get in line” when it requests reports. Without access to near real-time data, HR’s ability to be proactive and head off potential issues can be hampered.

9 capabilities of a strong people analytics tool
The right analytics tool can deliver powerful advantages to organizations, enabling HR and other users to rapidly address issues, replicate and amplify successful programs and behaviors, and invest resources in actions that will yield better workforce and business outcomes. Essentially, HR data is business data. Your people analytics capabilities should encompass these nine characteristics.
Simplicity and accessibility
Above all, a people analytics tool should be a self-service, easy-to-use instrument that doesn’t require special training in data analytics. While using such tools will necessitate some level of education and time for acclimation, any HR leader or other user should be able to access the data needed through out-of-the-box guidebooks with dashboards that can answer their most commonly asked questions related to performance. These may include:
- Are managers building better relationships to optimize team performance?
- What types of conversations are helping drive performance?
- Which employees are engaged versus those needing support, and what type would be most effective?
- Where are my top performers in the organization and are there “hidden gems” who will flourish with the right opportunities?
- Which employee and manager behaviors are associated with changes in performance ratings?
- What are behaviors that characterize the most effective managers in our organization?
Easily customizable
Each organization will have specific metrics it wants to track. Data analytics tools should enable users to use filters and widgets to quickly develop custom dashboards. They should incorporate custom flags and alerts to keep users informed of the health status of a specific metric.
Data frequency and granularity
The value of people analytics is tied to the frequency and quality of the unstructured and structured data that the system can collect and analyze. Such data includes, for example, the frequency of performance and career development conversations between managers and employees, the recurring issues that come up in conversations, the completion of performance and aspirational goals, what percentage of teams or departments are setting, monitoring and achieving goals, the amount and quality of feedback and peer recognition, and calibration data.
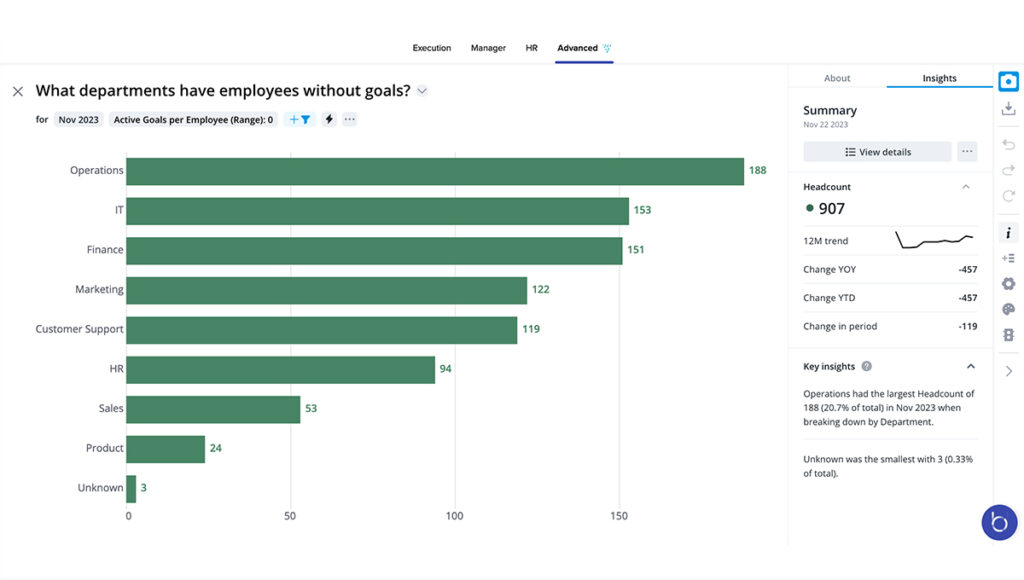
Sample screen: This view identifies which departments have employees without goals based on a customizable time period, allowing HR to further analyze the adoption of its goals program and highlighting where it needs to focus attention.
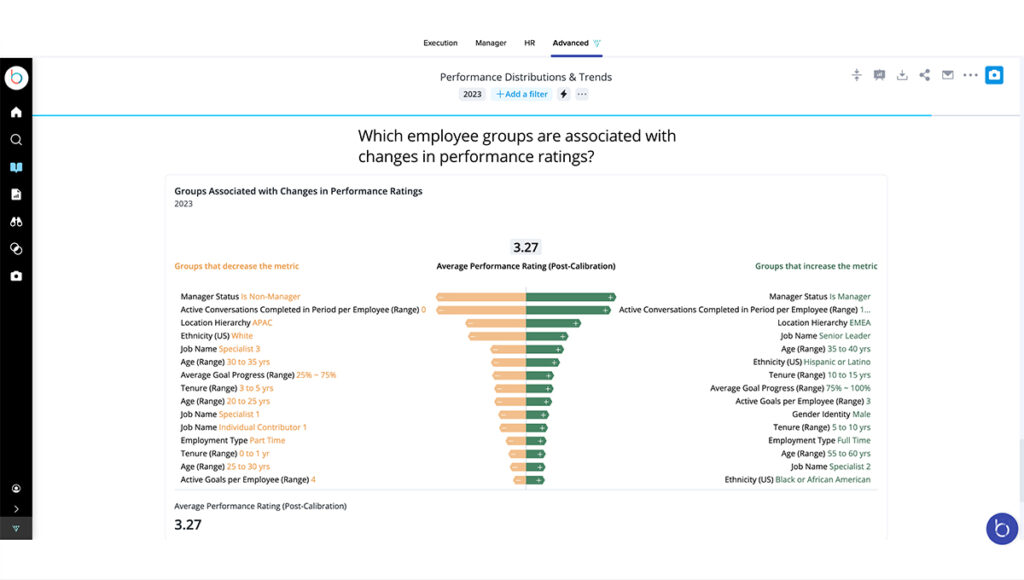
Sample screen: This view allows HR to identify where to focus to drive the most impact. In particular, it reveals that HR should focus on the APAC region, rather than new employees (i.e., < 1 year), to drive improvement in performance ratings.
Cross-Correlations
Cross-correlation exponentially multiplies the power of any analytics tool by surfacing patterns, trends, and insights that are not otherwise visible. HR should be able to see leading indicators of strong and poor performance, effective and ineffective managers, and team behaviors of high- and low-performing teams. Correlation also enables HR to drill down with specificity to an individual level. With such knowledge, HR can take the right actions to amplify successes and corrective action to reduce or avoid negative repercussions.
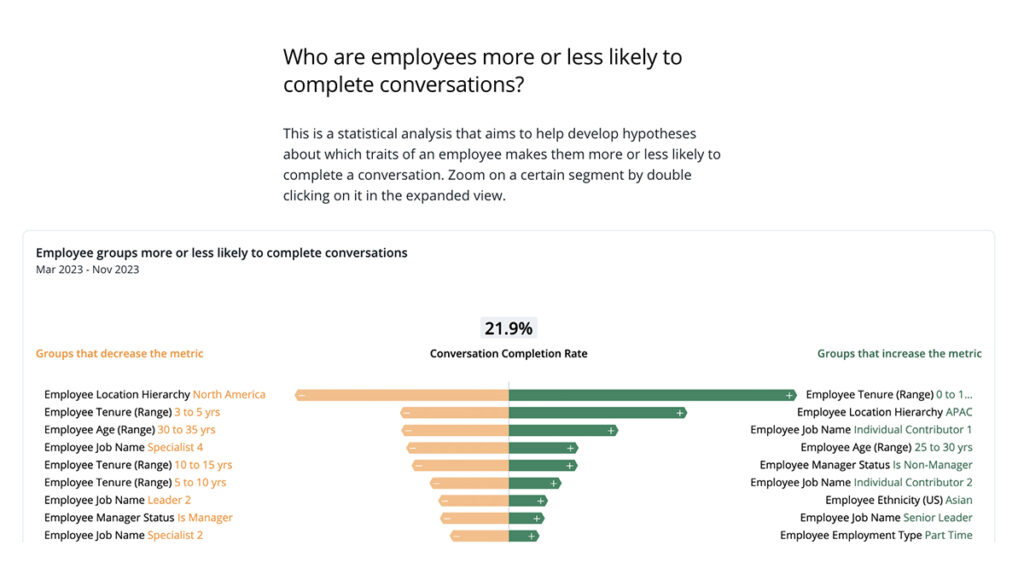
Sample screen: This cross-correlation allows HR to understand which groups are and are not completing conversations across a variety of traits, helping HR to see where to celebrate and where to focus. In this particular example, APAC has a high completion rate. HR can drill down further to learn what makes this region so successful. Additionally, the visualization reveals that the organization needs to focus on employees who have been at the company for 3-5 years instead of just managers.
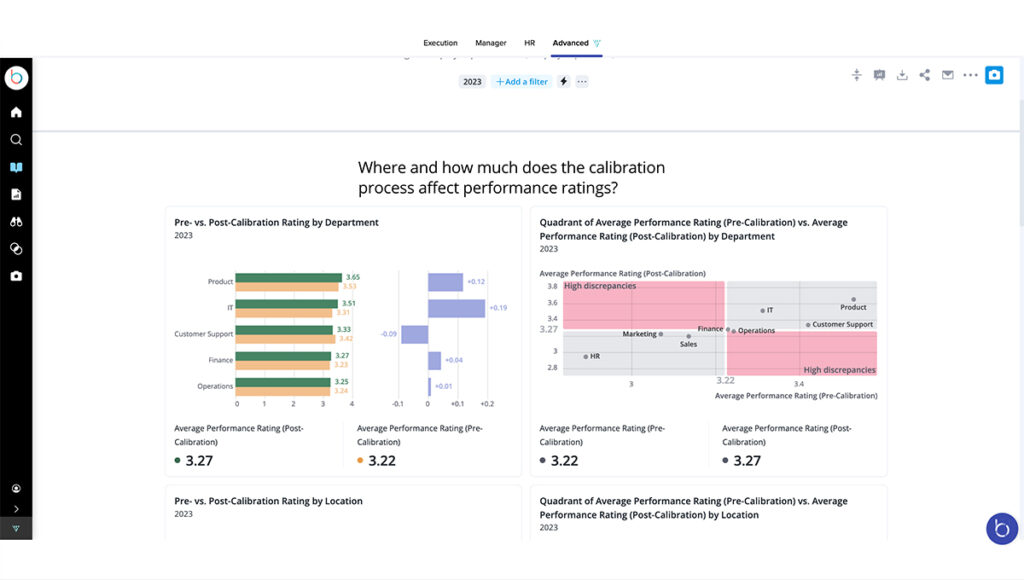
Sample screen: In this cross-correlation, the average departmental performance rating pre- and post-calibration can help HR better understand where there are high- and low-performing teams and where there are gaps between managers’ expectations and the company’s expectations. Such data can also help HR identify significant discrepancies in ratings between departments. This may indicate that certain departments require additional training or other support to properly identify talent.
Powerful visualizations
Users should be able to instantly understand the story revealed by the analytics. Easy-to-understand visualizations are powerful because they allow users to accomplish two crucial activities: to ask the next question or related questions to dive deeper and to enable rapid and accurate decision-making.
Comprehensiveness
Closely tied to data frequency and granularity is the comprehensiveness of the data. The more performance-related data there is to draw from, the more powerful the analytics and visualizations, and thus, the more insightful and even predictive the data will be. This is where a dedicated performance management solution provides a unique advantage that a one-size-fits-all solution like an HCM cannot equal. Performance modules within HCM systems are simply not designed to gather the robust data available in a targeted solution.

How to improve performance management within your Workday HCM
Democratized analytics
The value of HR analytics grows exponentially when aspects of it can be put directly into the hands of managers to help them better understand and improve their team’s performance in real-time without having to wait for HR or an HR business partner to send them a report.
Managers can immediately see in a single view how their direct reports compare in areas like goal accomplishment and complexity and whether those who are receiving more feedback are more productive, for example. These insights, or other cross-correlations the manager might run, can help them see where an employee might be struggling and needing more guidance, or what projects are running into bottlenecks.
Analytics tools should allow users to automate the scheduling of custom reports to other users to simplify and speed data democratization; in other words, getting the right data to the right people at the right time.
Betterworks Advanced Analytics
Betterworks has partnered with Visier to develop Betterworks Advanced Analytics, a people analytics tool that offers a question-based approach to help users, like HR and — in the near future — managers, uncover new insights that can help them boost performance, effectiveness, and employee satisfaction. With ready-made dashboards and questions based on research and robust data, Advanced Analytics can help users unleash data to drive positive change in your organization.
For more information on Betterworks Advanced Analytics, download our datasheet or request a demo.
Paul Agustin is the director of solutions engineering at Betterworks, where he serves as a subject-matter expert on the technical and functional concepts of the Betterworks performance enablement solution and supports both the sales team and prospects about how the platform can be used. Previously, he helped build and scale the organization and standardize customer services.
Discover what Betterworks Advanced Analytics can do for you